SLU/YouGov Poll Analysis: Voters’ Views on the Quality of Missouri’s Public Schools
08/29/2024
The SLU PRiME Center’s Abigail Medler, MPA and Courtney Vahle, Ed.D. provide expert analysis on the latest SLU/YouGov Poll results as they pertain to voters’ perceptions of the quality of public schools.
This year, Missouri public schools will educate more than 879,000 students in grades PK–12. The August 2024 SLU/YouGov Poll gathered the opinions of 900 likely Missouri voters on their perceptions of the quality of public schools across the state.
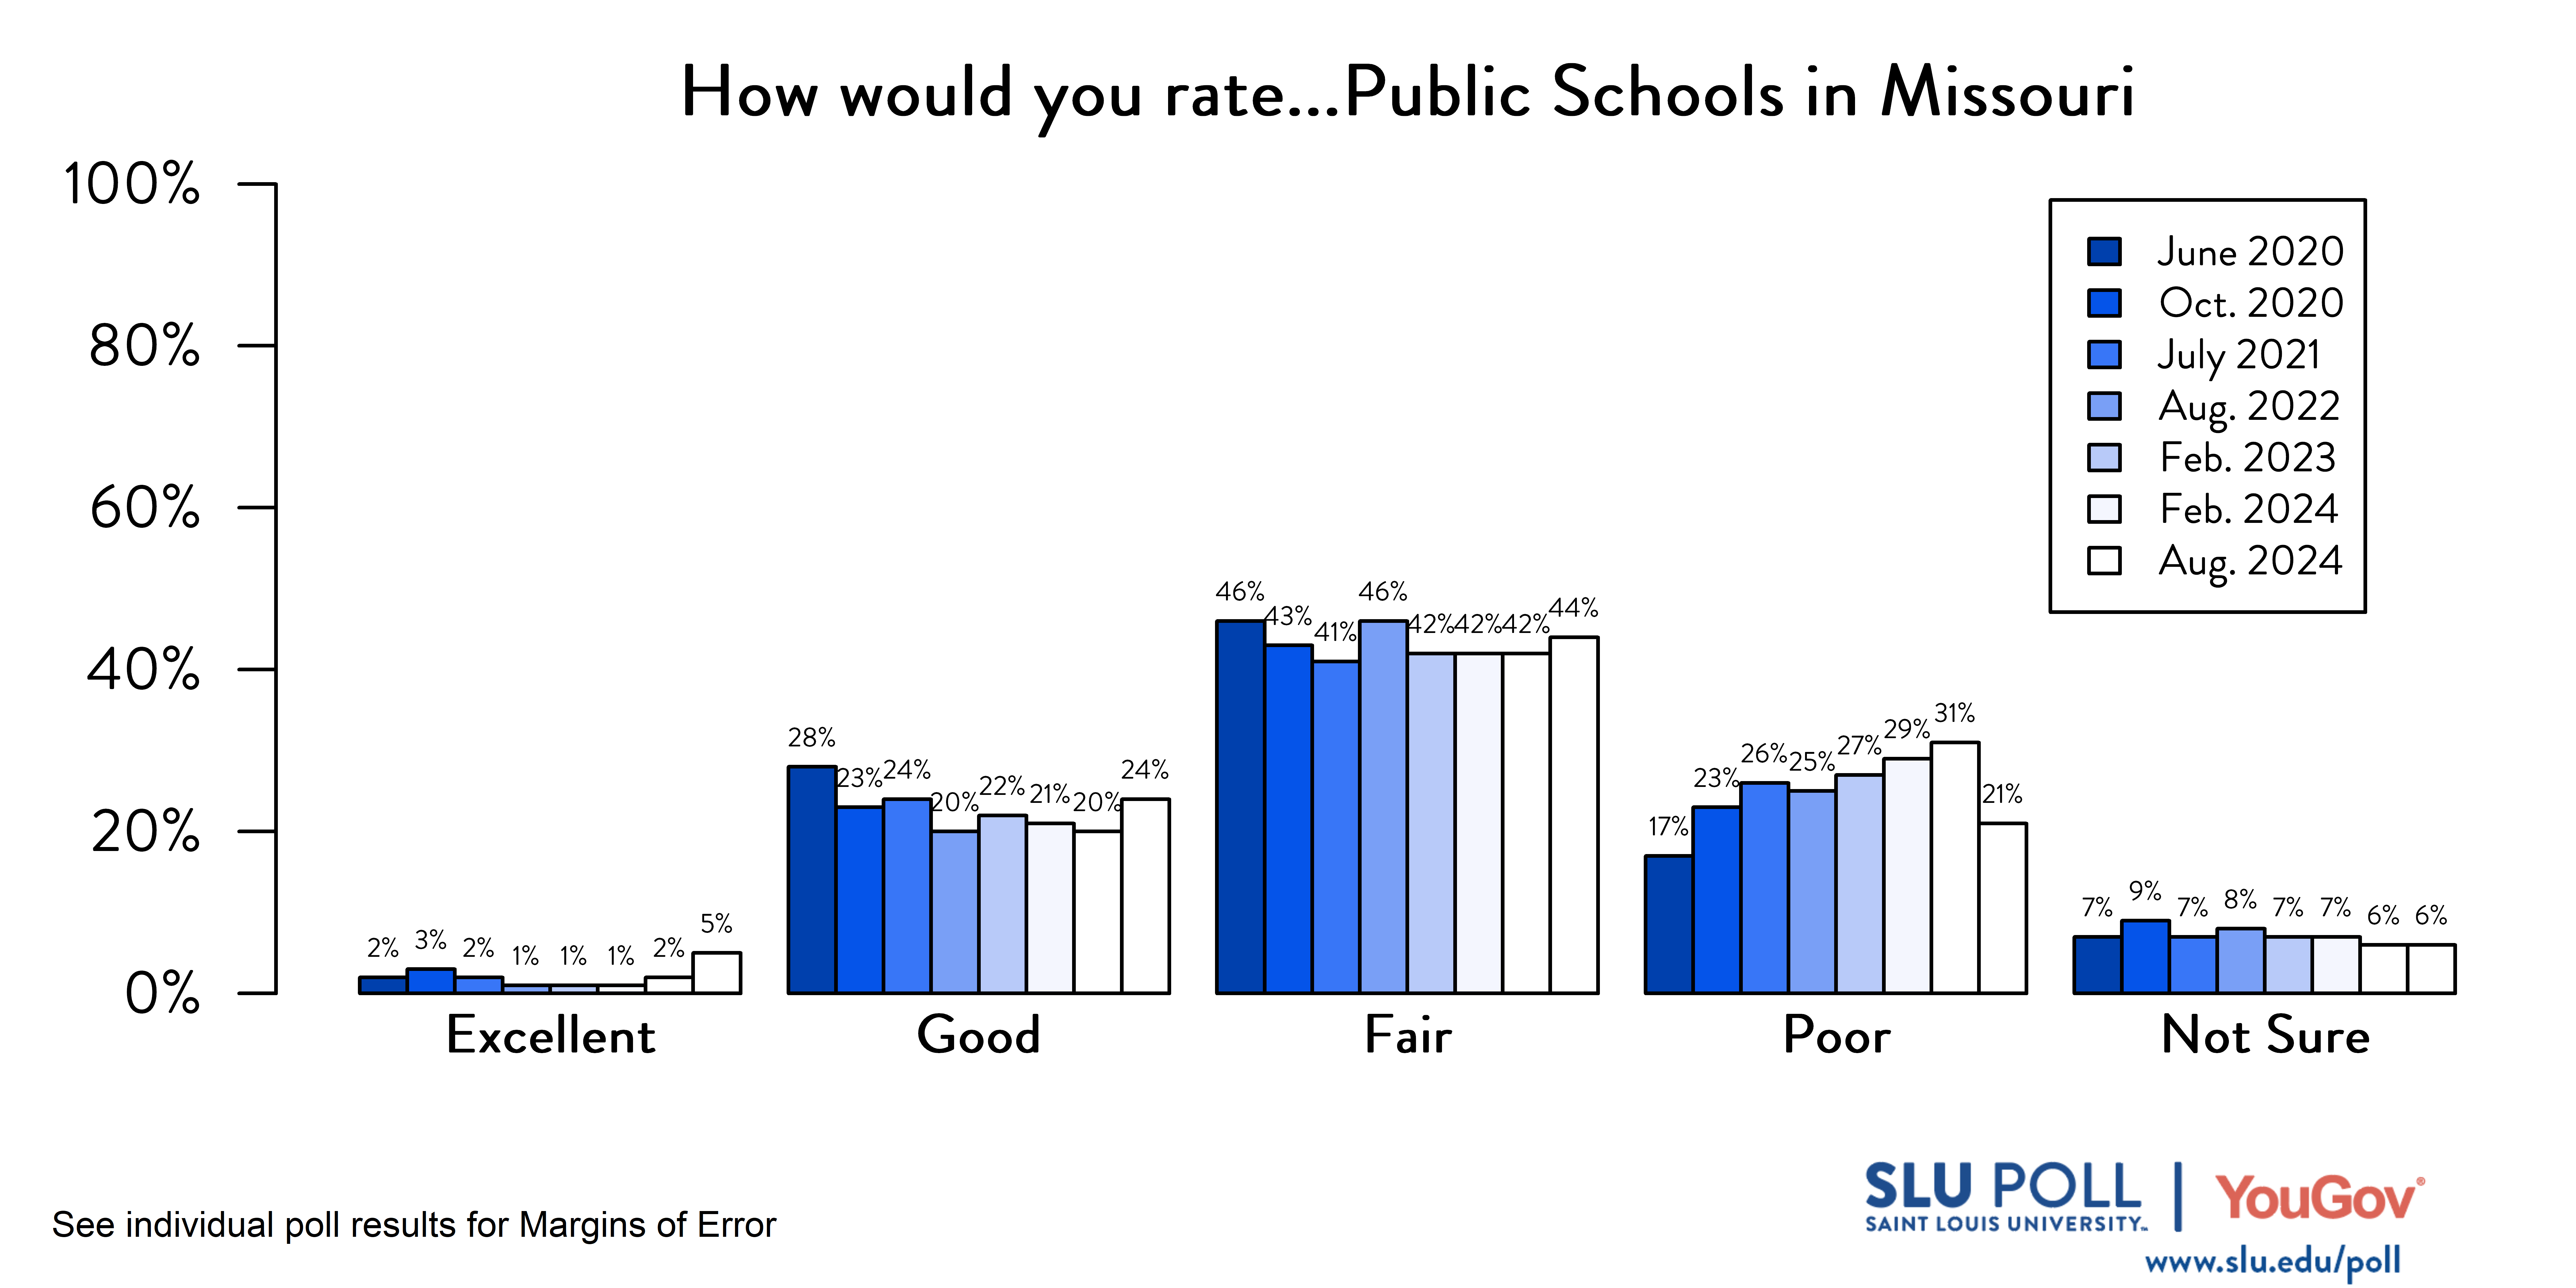
In a series of questions asked on every SLU/YouGov Poll since 2020, two trends have emerged: a decline in likely voters’ opinions of public schools overall, and a consistently higher opinion of schools in respondents’ own neighborhoods, as compared to their perception of all Missouri public schools. Notably, this poll saw the quality of public schools across the state of Missouri poll higher than in previous years, with only 21% of respondents ranking public schools as “poor” — a full 10 percentage points lower than the poll administered this past February. This marks a turning point in a post-COVID decreasing opinion of public schools.
When asked what factors influence their perception of public schools, almost one-third (31%) of voters attributed their perspectives to their own schooling experience. This could indicate that these respondents may be living in the same community they attended school in, which is not unlikely considering nearly six in ten U.S. young adults live within ten miles of where they were raised. Additionally, about a quarter of voters attributed their ranking to their child’s schooling experience and 22% to the experiences of others.
When determining the quality of public schools in Missouri, roughly three-quarters (77%) of respondents ranked teachers as one of the top three most important factors, with equal partisan agreement (78%). This bipartisan agreement is critical to note at a time when more than 70% of Missouri teachers have reported seriously considering leaving the profession.
In addition to teachers, two-thirds of respondents attributed their perception of school quality to the school’s academic reputation (64%), which was also consistent across parties. Class sizes (54%) and student test scores (51%) followed, with student test scores seeing a divide across age groups. Student test scores were chosen about four in ten times by 18-44-year-olds, but almost six in ten times by 65+-year-olds. This divide could be due in part to the post-pandemic switch to test-optional admissions and the recent discourse surrounding their viability and connectedness to student success.
Missouri public school enrollment declined by about 2.8% between 2013 and 2022. It remains unclear where departing students may be going because Missouri does not track private school enrollment nor are parents required to report the decision to they have begun homeschooling. Missouri students have many options regarding their high school education, making it imperative that the quality of public schools, where most Missouri students attend school, is regularly assessed by its constituents.
This analysis is based on data from the August 2024 SLU/YouGov poll and reflects the opinion of the authors.
